Tek-Tips is the largest IT community on the Internet today!

Members share and learn making Tek-Tips Forums the best source of peer-reviewed technical information on the Internet!

  • Congratulations MikeeOK on being selected by the Tek-Tips community for having the most helpful posts in the forums last week. Way to Go!

Need Genius Help - Finding multiple duplicates between columns - EXCEL

Kim296

MIS
Aug 24, 2012
111
US
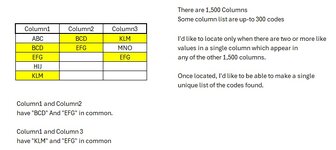
I really need some help from a genius. I'm working on a dynamic excel spreadsheet. There are over 1,500 columns with list data below each one. Does anyone know how I can dynamically find two or more like values that appear in any of the 1,500 columns. I don't just want to highlight duplicates. I need to determine if more than two (same values) appear in any of the columns independently of each other. I've attached a sample of the column row values. Any direction in the right way to calculate this using a formula is appreciated. I've tried alot of different ideas over two weeks, but I am coming up empty.
 

Attachments

  • screen_shot4.jpg
    screen_shot4.jpg
    54.8 KB · Views: 11
I don't know if you ever worked with power query. Since a couple of recent Excel versions it is a built-in com add-in. A single query is a sequence of transformations that are recorded in power query desktop. The steps can be edited, it is also possible to write query without recording. The full M code in M language (as below) is displayed in advanced editor. All code below is a result of recording with small clean up.

I started with converting data to structured table and named it 'tData'.
The first query started as query from table, with some future steps. It is named 'tData' and remained as connection only. The M code:
Code:
let
    Source = Excel.CurrentWorkbook(){[Name="tData"]}[Content],
    #"Changed Type" = Table.TransformColumnTypes(Source,{{"Column1", type text}, {"Column2", type text}, {"Column3", type text}}),
    #"Added Index" = Table.AddIndexColumn(#"Changed Type", "Index", 1, 1, Int64.Type),
    #"Unpivoted Other Columns" = Table.UnpivotOtherColumns(#"Added Index", {"Index"}, "Column", "Code")
in
    #"Unpivoted Other Columns"

The second query, 'qAggregate' is displayed below the table with source data. M code:
Code:
let
    Source = tData,
    #"Grouped Rows" = Table.Group(Source, {"Code"}, {{"Count", each Table.RowCount(_), Int64.Type}}),
    #"Filtered Rows" = Table.SelectRows(#"Grouped Rows", each ([Count] <> 1))
in
    #"Filtered Rows"

The final four columns query M code:
Code:
let
    Source = qAggregate,
    #"Merged Queries" = Table.NestedJoin(Source, {"Code"}, tData, {"Code"}, "tData", JoinKind.LeftOuter),
    #"Expanded {0}" = Table.ExpandTableColumn(#"Merged Queries", "tData", {"Index", "Column"}, {"Index", "Column"})
in
    #"Expanded {0}"
 
BTW, it is a result of the queries with your data:
View attachment 2350
I definitely appreciate your time and response.

I originally uploaded a few columns of my actual data in a screen shot, but it was confusing to the people trying to understand my question. So, I replaced it with sample data; hence, abc, bcd, etc..

After looking your suggestion in comparison to my worksheet, this approach will not work. In my worksheet, every code (within all the columns) are already narrowed down to duplicate values. There are no unique values in my worksheet to filter out.

I'm sorry that I can't explain this better. Thank you.
 
I don't know if you ever worked with power query. Since a couple of recent Excel versions it is a built-in com add-in. A single query is a sequence of transformations that are recorded in power query desktop. The steps can be edited, it is also possible to write query without recording. The full M code in M language (as below) is displayed in advanced editor. All code below is a result of recording with small clean up.

I started with converting data to structured table and named it 'tData'.
The first query started as query from table, with some future steps. It is named 'tData' and remained as connection only. The M code:
Code:
let
    Source = Excel.CurrentWorkbook(){[Name="tData"]}[Content],
    #"Changed Type" = Table.TransformColumnTypes(Source,{{"Column1", type text}, {"Column2", type text}, {"Column3", type text}}),
    #"Added Index" = Table.AddIndexColumn(#"Changed Type", "Index", 1, 1, Int64.Type),
    #"Unpivoted Other Columns" = Table.UnpivotOtherColumns(#"Added Index", {"Index"}, "Column", "Code")
in
    #"Unpivoted Other Columns"

The second query, 'qAggregate' is displayed below the table with source data. M code:
Code:
let
    Source = tData,
    #"Grouped Rows" = Table.Group(Source, {"Code"}, {{"Count", each Table.RowCount(_), Int64.Type}}),
    #"Filtered Rows" = Table.SelectRows(#"Grouped Rows", each ([Count] <> 1))
in
    #"Filtered Rows"

The final four columns query M code:
Code:
let
    Source = qAggregate,
    #"Merged Queries" = Table.NestedJoin(Source, {"Code"}, tData, {"Code"}, "tData", JoinKind.LeftOuter),
    #"Expanded {0}" = Table.ExpandTableColumn(#"Merged Queries", "tData", {"Index", "Column"}, {"Index", "Column"})
in
    #"Expanded {0}"
I'm not familiar with Power query. This looks foreign to me, but I love a challenge. I will take this and try to learn what you are doing. Thank you so much for your time spent trying to help me find a solution. I really appreciate you!!
 
I guess my question (with possible solution) is ignored :(
No, I did reply. I would love to hear your suggestion on VBA. I haven't see the response. I will go back and look again. I'm sorry. I value everyone's time and responses.
 
OK, here is what I've got, assuming:
1. there are no Empty cells in any columns that separate data (columns can have different number of data, but once empty cell is detected, no data below for that column)
2. Data starts in Row 2 (Row 1 is a Header row)

Code:
Option Explicit

Sub Kim296()
Dim iCol1 As Integer
Dim iCol2 As Integer
Dim iRow1 As Integer
Dim iRow2 As Integer
Dim bFirstIsFound As Boolean
Dim iFoundRow1 As Integer
Dim iFoundRow2 As Integer

'Application.ScreenUpdating = False

For iCol1 = 1 To ActiveSheet.UsedRange.Columns.Count - 1
    For iCol2 = iCol1 + 1 To ActiveSheet.UsedRange.Columns.Count
        iRow1 = 2
        bFirstIsFound = False
        Do While Cells(iRow1, iCol1).Value <> ""
            iRow2 = 2
            Do While Cells(iRow2, iCol2).Value <> ""
                If Cells(iRow1, iCol1).Value = Cells(iRow2, iCol2).Value Then
                    If Not bFirstIsFound Then
                        iFoundRow1 = iRow1
                        iFoundRow2 = iRow2
                        bFirstIsFound = True
                    Else
                        Cells(iFoundRow1, iCol1).Interior.Color = vbYellow
                        Cells(iFoundRow2, iCol2).Interior.Color = vbYellow
                    
                        Cells(iRow1, iCol1).Interior.Color = vbYellow
                        Cells(iRow2, iCol2).Interior.Color = vbYellow
                    End If
                End If
                iRow2 = iRow2 + 1
            Loop
            iRow1 = iRow1 + 1
        Loop
    Next iCol2
Next iCol1

'Application.ScreenUpdating = False

End Sub

If you have a LOT of data, uncomment ScreenUpdating in 2 places, that should speed up this code.
 
OK, here is what I've got, assuming:
1. there are no Empty cells in any columns that separate data (columns can have different number of data, but once empty cell is detected, no data below for that column)
2. Data starts in Row 2 (Row 1 is a Header row)

Code:
Option Explicit

Sub Kim296()
Dim iCol1 As Integer
Dim iCol2 As Integer
Dim iRow1 As Integer
Dim iRow2 As Integer
Dim bFirstIsFound As Boolean
Dim iFoundRow1 As Integer
Dim iFoundRow2 As Integer

'Application.ScreenUpdating = False

For iCol1 = 1 To ActiveSheet.UsedRange.Columns.Count - 1
    For iCol2 = iCol1 + 1 To ActiveSheet.UsedRange.Columns.Count
        iRow1 = 2
        bFirstIsFound = False
        Do While Cells(iRow1, iCol1).Value <> ""
            iRow2 = 2
            Do While Cells(iRow2, iCol2).Value <> ""
                If Cells(iRow1, iCol1).Value = Cells(iRow2, iCol2).Value Then
                    If Not bFirstIsFound Then
                        iFoundRow1 = iRow1
                        iFoundRow2 = iRow2
                        bFirstIsFound = True
                    Else
                        Cells(iFoundRow1, iCol1).Interior.Color = vbYellow
                        Cells(iFoundRow2, iCol2).Interior.Color = vbYellow
                   
                        Cells(iRow1, iCol1).Interior.Color = vbYellow
                        Cells(iRow2, iCol2).Interior.Color = vbYellow
                    End If
                End If
                iRow2 = iRow2 + 1
            Loop
            iRow1 = iRow1 + 1
        Loop
    Next iCol2
Next iCol1

'Application.ScreenUpdating = False

End Sub

If you have a LOT of data, uncomment ScreenUpdating in 2 places, that should speed up this code.
Thank you very much for your time and suggestion. I am not very versed on VBA; I'm learning. I will try your suggestion today and see if I can figure it out. It looks pretty short and simple. Thank you again!
 
If you don't want to use VBA, you can try Python in Excel:

python_in_excel.png

Python:
# read excel data into data frame
df_inp = xl("A1:C6",headers=True)
columns = df_inp.columns.to_list()
my_list = []
for col in columns:
  my_list = my_list + df_inp[col].to_list()
# create dictionary: counting all non-empty elements
count = {}
for elem in my_list:
  if elem != None:
    if elem in count:
      count[elem] += 1
    else:
      count[elem] = 1
# remove all non-duplicates from dictionary
for key in list(count.keys())[:]:
  if count[key] == 1:
    count.pop(key, None)
# create resulting data frame
df_out = pd.DataFrame.from_dict({"data": list(count.keys()), "occurs": list(count.values())})
df_out.index += 1
# output data frame to excel
df_out
 

Part and Inventory Search

Sponsor

Back
Top